5.7 Logit and probit - logistic regression analysis
Logistic regression analysis is a tool for estimating the probability of "success" (one condition in front of another) or to end up in one of several possible states.
Syntax:
logit <variable> <variable list> [if <condition>] [, <options>]
probit <variable> <variable list> [if <condition>] [, <options>]
The dependent variable must be entered first, followed by the
explanatory variables. Options can be used for various purposes, such as robust or cluster estimation, cf. the sections below. Like other statistical commands, regression commands can be combined with an if condition to run regressions on selected groups. For a full list of
options, use the help logit or help probit command.
The commands logit and probit can be used to perform a logistic analysis where the dependent variable is a categorical variable with 2 possible outcomes (dummy variable). Examples may be job/non-job, retired/non-retired etc. Logit models assume that the probability of "success" follows a logarithmic (log) distribution, while the probit variant assumes a normal distribution. The two distributions are virtually the same, and the results will therefore be approximately the
same. However, Logit is the most widely used model, and that is the one we focus on in the examples below.
The result of logit provides a table of common values such as
coefficients, standard deviations, z-values, p-values, and confidence intervals. The numbers in the main table are linked to the different variables, while the numbers at the top refer to the analysis model as a whole (indicate the model's quality/explanatory power).
Example:
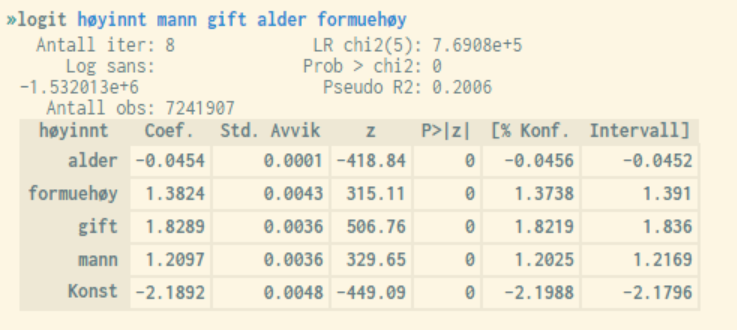
In the example above, the dependent variable høyinnt (high income) is coded as follows:
generate høyinnt = 0
replace høyinnt = 1 if income05 > 400000
Factor variables, and cluster and robust estimation can also be used. The procedure is the same as for ordinary linear regression. See respectively chapter 5.4.1 and 5.4.3 for more information on this.
Like ordinary linear regression analysis (see section 5.4), some numbers are more important to study than others. The P-value, "Prob > chi2", indicates how good the statistical model is, i.e. it is an estimation of the explanatory power of the sum of all independent variables. The closer to 0 the better, and values should be below 0.05.
Pseudo R2 is a variant of Justert (Adjusted ) reported by ordinary linear regression analyses, indicating how much of the variance in the response variable is explained by the independent variables (scale from 0 to 1 where highest possible values are ideal). However, this overall measure should be interpreted with great caution, as in many cases it indicates a value that is either artificially high or low. "Prob > chi2" is therefore recommended for logistic regression models.
The p-values of the variables, "P > |z|", correspond to "P > |t|" in ordinary linear regression analysis. The limit value here is also 0.05 if operating with a significance level of 5% (commonly used). Reported values below this limit imply that the associated variable is significant at a 5% level.
Studies of z-values or associated p-values give the same conclusions. The z-value is a standardized version of the coefficient value, which has an expectation equal to 0 and where values exceeding +/- 1.96 imply that the corresponding variable has a significant influence on the likelihood of "success". Positive values indicate positive effect, and vice versa.
The confidence interval given by the two rightmost columns can be interpreted in the same way as for ordinary linear regression analysis, i.e. if it includes the value 0, this indicates zero significance.
As can be seen in the example above, all explanatory variables are significant with a good margin (high z-values). "Alder" (Age) has a negative effect on the probability of ending up in a high income group, while the other variables have a correspondingly positive effect. Furthermore, the model's P-value is equal to 0, which shows that we have a good explanatory model.